An extremely interesting result concerning the consistency of majority rule was produced by the Australian political scientist Duncan Black. In a book called The Theory of Committees and Elections, published in 1958, Black proved an important theorem about circumstances under which majority rule is guaranteed to produce a transitive social preference ordering. In a moment, I am going to go through the proof in detail, but let me first explain intuitively what Black proved. Ever since the French Revolution, political commentators have adopted a convention derived from the seating arrangement in the National Assembly. In that body, Representatives belonging to each party were seated together, and the groups were arrayed in the meeting hall in such a manner that the most radical party, the Jacobins, sat on the extreme left of the hall, and the most reactionary party, the Monarchists, sat on the right, with the other groups seated between them from left to right according to the degree to which their policies deviated from one extreme or the other. Thus was born the left-right political spectrum with which we are all familiar. [Of course, in the U. S. Senate, there are no Communists and only one Socialist, but, as the reign of George W. Bush shows, there are still plenty of Monarchists.]
The interesting fact, crucial for Black's proof, is that wherever a party locates itself on the spectrum, it tends to prefer the positions of the other parties, either to the left or to the right, less and less the farther away they are seated. So, if an individual identifies himself with a party in the middle, he will prefer that party's positions to those of a party a little bit to the left, and he will prefer the policies of the party a little bit to the left over those of a party farther to the left, and so on. The same is true looking to the right. Notice that since only ordinal preference is assumed, you cannot ask, "Is a party somewhat to the left of you farther from you than a party somewhat to the right of you?" [Make sure you understand why this is true. Ask me if it is not.]
Consider contemporary American politics. If I am a moderate Republican [assuming there still is one], I will prefer my position to that of a conservative Republican, and I will prefer that position to a right wing nut. I will also prefer my position to that of a Blue Dog Democrat [looking to my left rather than to my right], and that position to the position of a Liberal Democrat, and that position in turn to the position of a Socialist [Bernie Sanders?].
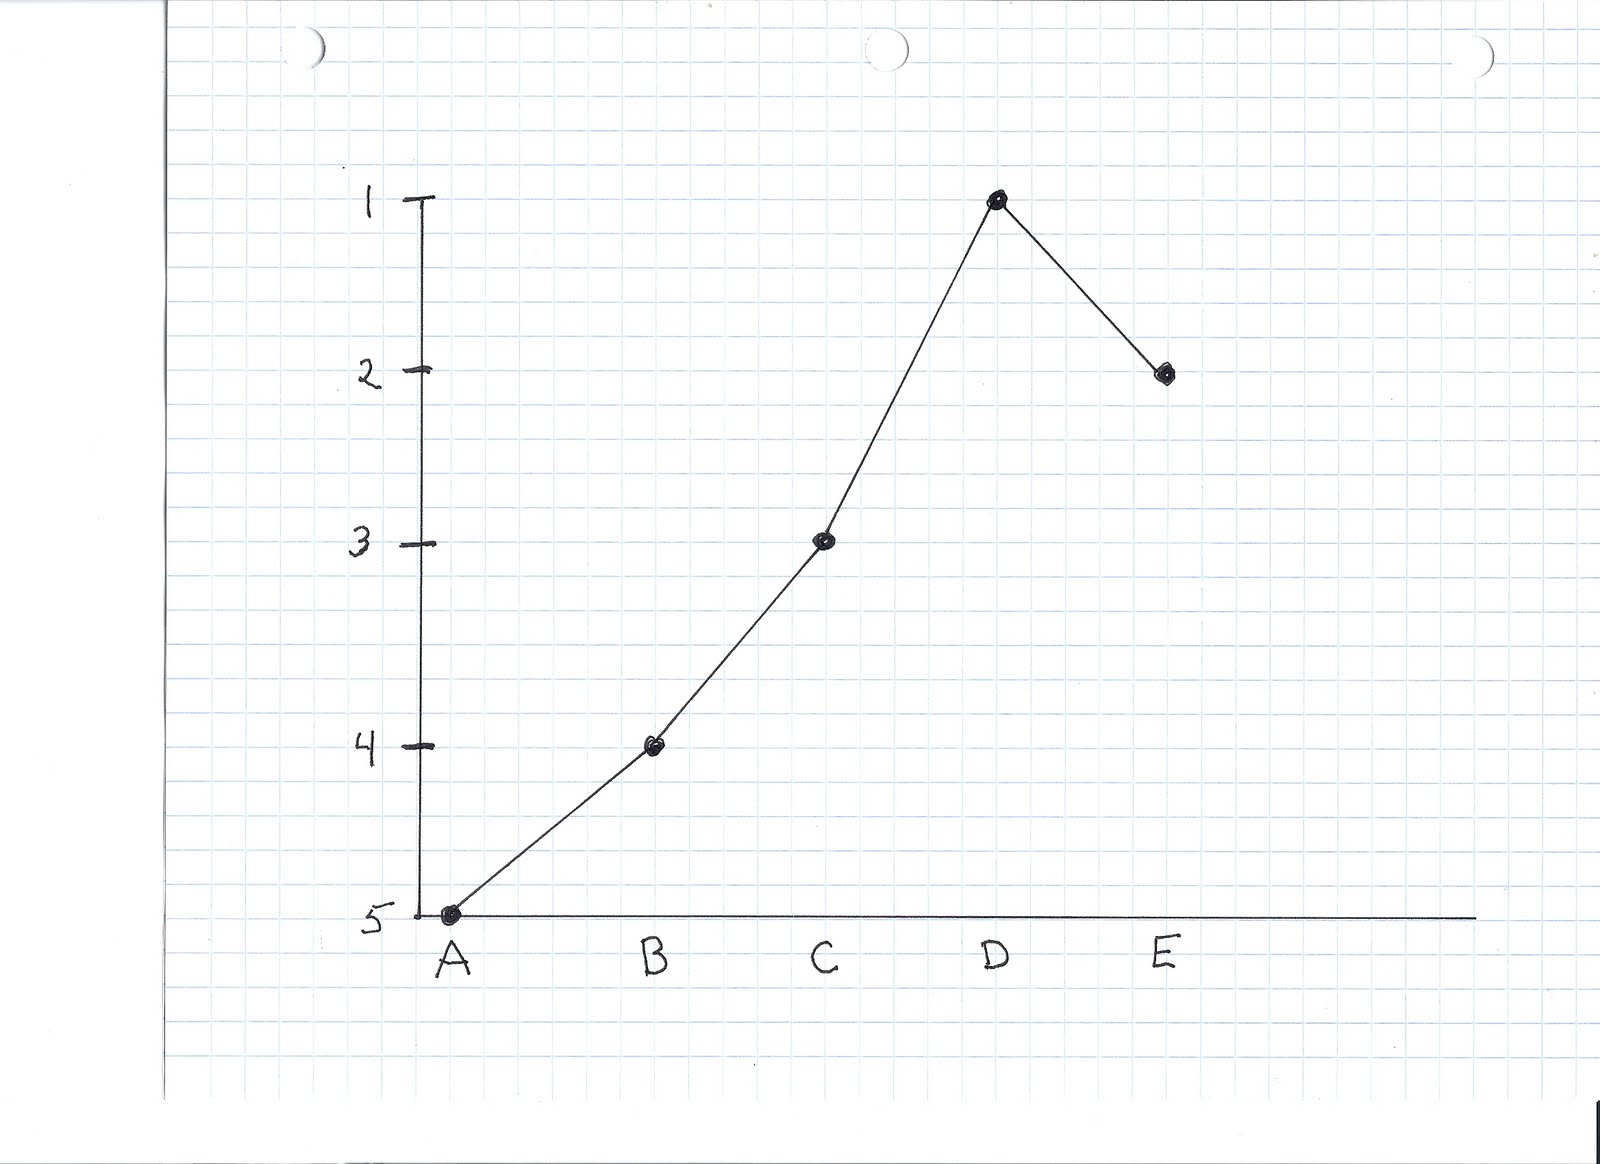
This can be summarized very nicely on a graph, along the X-axis of which you lay out the left-right political spectrum, while on the Y-axis you represent the order of your preference. Pretty obviously, the graph you draw will have a single peak -- namely, where your first choice is on the X-axis -- and will fall away on each side, going monotonically lower the farther you get on the X-axis from your location on it. In short, your preference, when graphed in this manner, will be single-peaked. Here is an example of a person's preference order graphed in this manner. For purposes of this example, there are five alternatives, (a, b, c, d, e), and the individual has the following preference order: d > e > c > b > a
Let us suppose that there is a second person whose preference order is a > b > c > d > e. It is obvious that if we posted this person's preferences on the same graph, the two together would look like this:

Notice that each of these lines has a single peak. The first individual's line peaks at alternative D; the second's at alternative A. If you do a little experimenting, you will find that if you change the order in which the alternatives are laid out on the X-axis, sometimes both lines are still single peaked, sometimes one remains single peaked and one no longer is. Sometimes neither is single peaked. Fr example, if you change the order slightly so that the alternatives are laid out on the X-axis in the order a B E D C, the first individual's line will still be single peaked, but the second individual's line will now be in the shape of a V with one peak at A and another peak at C. [Try it and see. It is too much trouble for me to draw it and scan it and size it and insert it.]
Suppose now that we have an entire voting population, each with his or her own preference order, and that we plot all of those preference orders on a single graph, a separate line for each person. There might be some way of arranging the alternatives along the X-axis so that everyone's preference order, when plotted on that graph, is single peaked. Then again, there might not be. For example, if you have three people and three alternatives, and if those three people have the preferences that give rise to the Paradox of Majority Rule, then there is no way of arranging the three alternatives along the X-axis so that all three individuals' preferences orders can be plotted on that graph single-peakedly. [Try it and see. Remember that mirror images are equivalent for these purposes, so there are really three possible ways of arranging the alternatives along the X-axis, namely xyz, xzy, and yxz.]
Duncan Black proved that if there is some way of arranging the available alternatives along the X-axis so that everyone's preference order, plotted on that graph, is single peaked, then majority rule is guaranteed to produce a consistent social preference order. Notice, in particular, that if everyone's preferences can be mapped onto the familiar left-right spectrum, with each individual preferring an alternative less and less the farther away it is in either direction from the most preferred alternative, then everyone will on that graph have a single peaked order [because it will peak at the most preferred alternative and fall away monotonically to the right and to the left.]
The proof is fairly simple. It goes like this.
Step 1: Assume that there are an odd number of individuals [the proof works for an even number of individuals, but in that case there can be ties, which produces social indifference, which then requires an extra couple of steps in the proof, so I am trying to make this as simple as possible.] Assume that their preferences can be plotted onto a graph so that all of the plots are single-peaked.
Step 2: Starting at the left, count peaks [there may be many peaks at the same point, of course, showing that all of those people ranked that alternative as first] and keep counting until you reach one more than half of the total number of peaks, i.e. (n/2 + 1). Assume there are p peaks to the left of that point, q peaks at that point, and r peaks to the right, with (p+q+r) = n. Now, by construction, (p+q) > n/2 and p
Step 3: Let us call the alternative with the q peaks alternative x. Clearly, there is a majority of individuals who prefer x to every alternative to the right of x on the graph, because there are p+q individuals whose plots are downward sloping from x as you go to the right, which means they prefer x to everything to the right, and p+q is a majority. But there are q+r individuals who prefer x to everything to the left of x, because their plots are downward sloping as you go to the left, and q+r are a majority. So alternative x is preferred in a pairwise comparison by a majority to every other alternative.
Step 4: Remove alternative x from the graph, remove alternative x from everyone's preference order, and then redraw all of the plots. They will all still be single-peaked. Why? Well, there are three possible cases: Either the dot representing the individual's ranking of x was the peak, or it was to the left of the peak, or it was to the right. In each case, when you reconnect the remaining dots, the graph remains single-peaked [try it and see. It is too hard to draw it and scan it and upload it. But it is intuitively obvious.]
Step 5: You now have a new set of single-peaked plots on a single graph, so go through Steps 2 and 3 all over again. The winning alternative is preferred to every other remaining alternative, and is of course inferior to the first winner. If you now iterate this process until you run out of alternatives, you are left with a fully transitive social preference established by repeated uses of majority rule.
Black's theorem has considerable real world application, as we have seen, but it of course does not identify necessary and sufficient conditions for majority rule to produce a transitive social preference order. It only identifies a sufficient condition, namely single-peakedness. This means that there are sets of individual preferences that cannot be mapped single-peakedly onto a single graph, and yet which by majority rule produce transitive social preference orders. I leave it to you to construct an example of this.

And those of us who have followed you thus far thank you for the journey! Well, I do, at least. I know that I for one have started to use phrases like 'because of the transitivity of ordinal preferences' much more than before (for good or for ill).
ReplyDeleteThank you very much for kindly sharing all this knowledge.
ReplyDeleteYou are both very welcome. It has been my pleasure.
ReplyDeleteI'd also like to express my appreciation. I'll certainly take appeals to formal methods with a grain of salt from here on in.
ReplyDeleteYes, indeed! This has been absolutely wonderful. Thanks so much for the help.
ReplyDeleteProfessor Wolff, I'd like to join my heartfelt gratitude to those of others. I will certainly be using this valuable resource for years to come, along with some other less accessible texts.
ReplyDeleteHopefully you will find a publisher for this material, or have it re-formatted as an open access course (as some people have previously suggested).